Latest Posts

Stay informed with our latest posts​ and articles, so you never miss important updates or engaging topics.

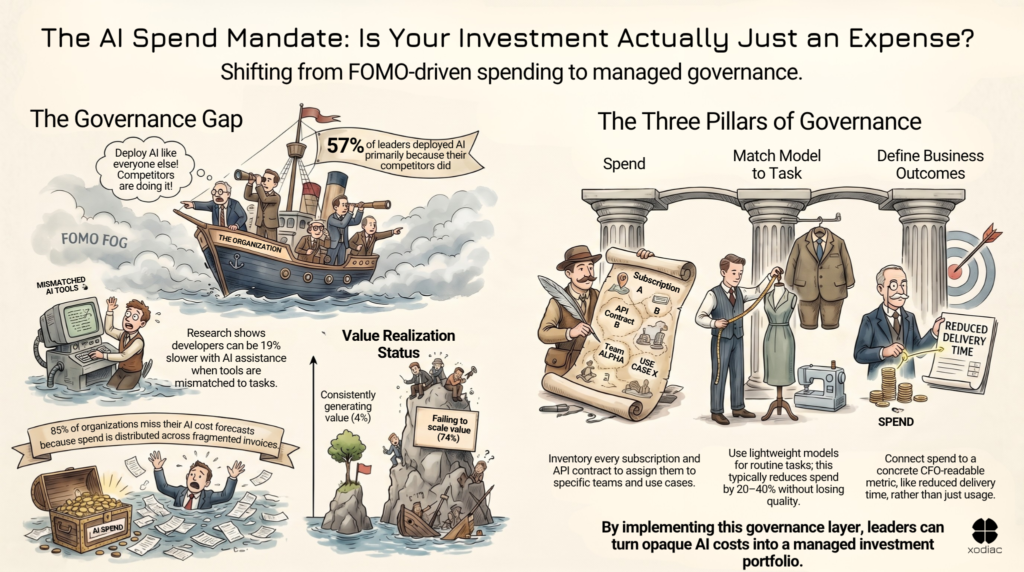
Infographic titled "The AI Spend Mandate: Is Your Investment Actually Just an Expense? Shifting from FOMO-driven spending to managed governance." Two sections. Left: "The Governance Gap" — an illustration of a ship labeled "The Organization" sailing through "FOMO Fog," with a figure declaring "Deploy AI like everyone else! Competitors are doing it!" Key statistics shown: 57% of leaders deployed AI primarily because competitors did; developers can be 19% slower with AI when tools are mismatched to tasks; 85% of organizations miss their AI cost forecasts because spend is distributed across fragmented invoices. A value realization chart shows 74% of organizations failing to scale value versus 4% consistently generating value. Right: "The Three Pillars of Governance" — illustrated columns labeled Spend, Match Model to Task, and Define Business Outcomes. Guidance includes: inventory every subscription and API contract by team and use case; use lightweight models for routine tasks to reduce spend 20–40% without losing quality; connect spend to a CFO-readable metric like reduced delivery time. Closing line: "By implementing this governance layer, leaders can turn opaque AI costs into a managed investment portfolio." Xodiac logo bottom right.

AI Spend Governance: Why Most Technology Leaders Can’t Answer the Three Questions That Matter

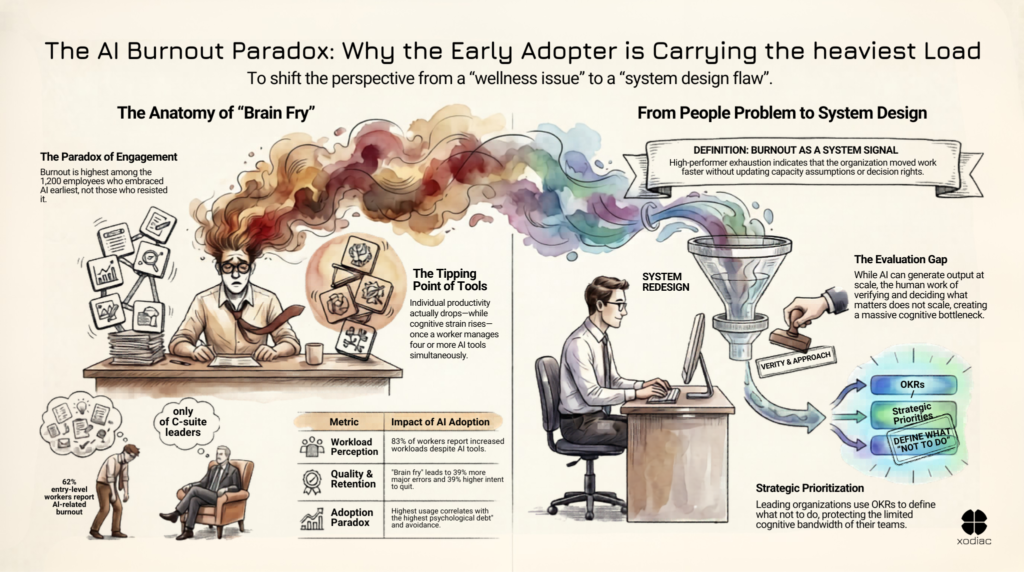
AI burnout paradox infographic: early adopters carry the highest cognitive load — brain fry anatomy, system redesign, and strategic prioritization with OKRs

AI Burnout: The People Who Said Yes First Are Paying the Price

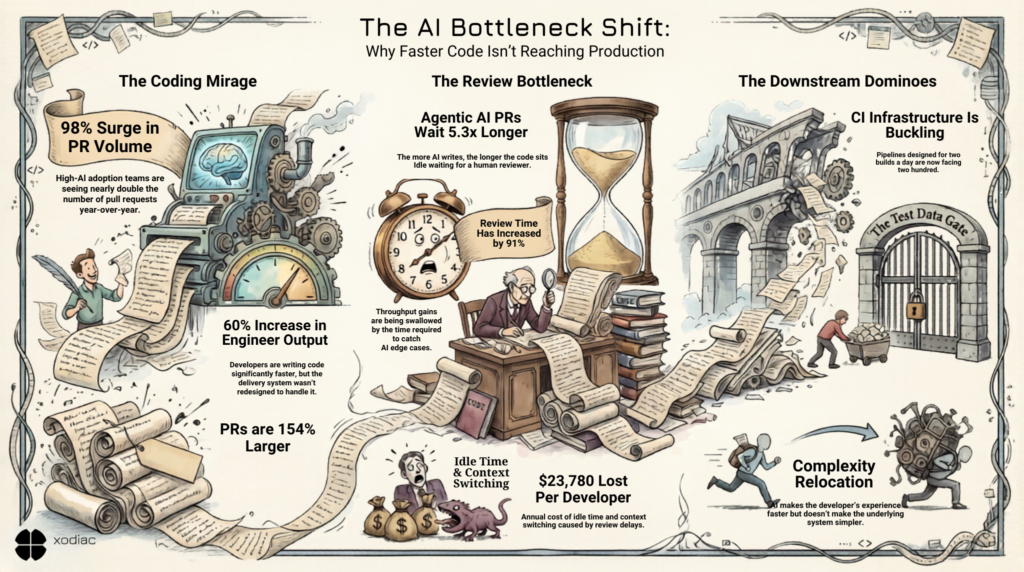
Infographic showing the AI bottleneck shift: PR volume up 98%, review time up 91%, and $23,780 lost per developer per year due to AI code review delays

Faster Code. Slower Shipping. The AI Code Review Problem.

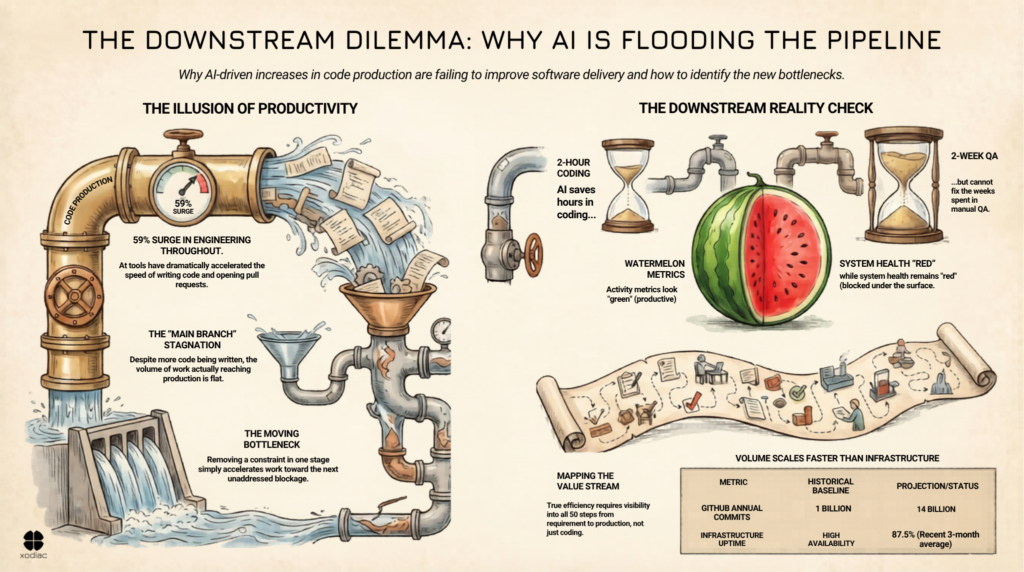
AI tools have increased engineering throughput by 59% — but release frequency is flat. Discover why the bottleneck didn't disappear, it just moved downstream, and what your team should measure instead.

The Bottleneck Didn’t Disappear. It Moved.

Infographic titled "The AI Spend Mandate: Is Your Investment Actually Just an Expense? Shifting from FOMO-driven spending to managed governance." Two sections. Left: "The Governance Gap" — an illustration of a ship labeled "The Organization" sailing through "FOMO Fog," with a figure declaring "Deploy AI like everyone else! Competitors are doing it!" Key statistics shown: 57% of leaders deployed AI primarily because competitors did; developers can be 19% slower with AI when tools are mismatched to tasks; 85% of organizations miss their AI cost forecasts because spend is distributed across fragmented invoices. A value realization chart shows 74% of organizations failing to scale value versus 4% consistently generating value. Right: "The Three Pillars of Governance" — illustrated columns labeled Spend, Match Model to Task, and Define Business Outcomes. Guidance includes: inventory every subscription and API contract by team and use case; use lightweight models for routine tasks to reduce spend 20–40% without losing quality; connect spend to a CFO-readable metric like reduced delivery time. Closing line: "By implementing this governance layer, leaders can turn opaque AI costs into a managed investment portfolio." Xodiac logo bottom right.

AI Spend Governance: Why Most Technology Leaders Can’t Answer the Three Questions That Matter

AI burnout paradox infographic: early adopters carry the highest cognitive load — brain fry anatomy, system redesign, and strategic prioritization with OKRs

AI Burnout: The People Who Said Yes First Are Paying the Price

Infographic showing the AI bottleneck shift: PR volume up 98%, review time up 91%, and $23,780 lost per developer per year due to AI code review delays

Faster Code. Slower Shipping. The AI Code Review Problem.

AI tools have increased engineering throughput by 59% — but release frequency is flat. Discover why the bottleneck didn't disappear, it just moved downstream, and what your team should measure instead.

The Bottleneck Didn’t Disappear. It Moved.