Why AI-Assisted Teams Are Shipping Less, Not More
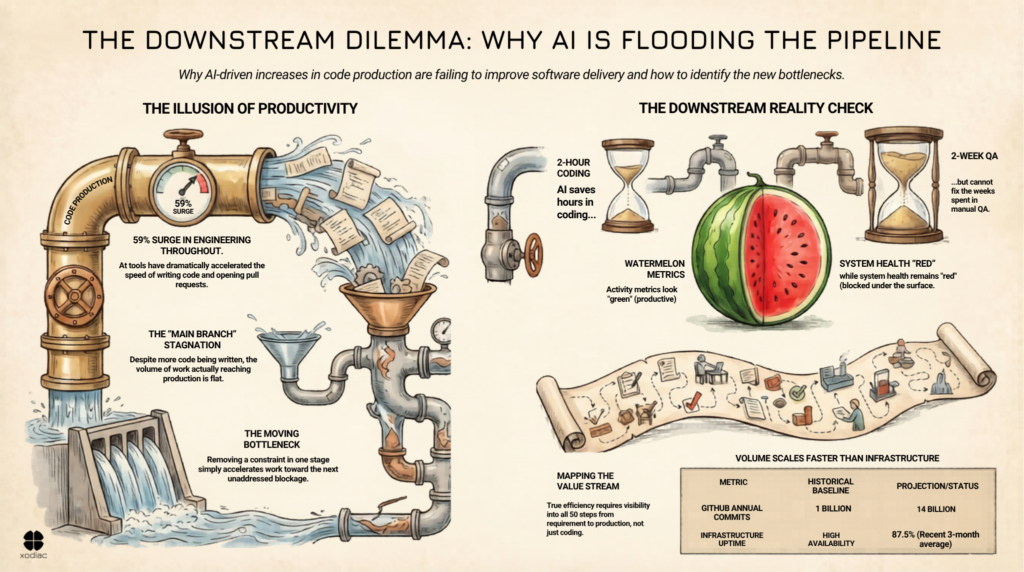
Engineering throughput is up 59% in 2026, driven by AI-assisted development tools. If you’re tracking lines of code written, pull requests opened, or feature branch activity, the numbers look strong. Better than strong: transformative.
So why aren’t teams shipping more?
New research from CircleCI shows that while feature branch throughput has surged, release throughput, the actual measure of work reaching production, is flat or declining for many organizations. More code is being produced. Fewer releases are going out. The productivity gains at the top of the pipeline haven’t translated to more frequent, more reliable delivery.
The bottleneck didn’t disappear. It moved downstream.
Understanding What Just Happened
Every delivery system has constraints: places where work slows down, queues up, or gets blocked before it can move forward. AI-assisted development tools have dramatically reduced one of those constraints: the time it takes to write code. That’s a real gain. But it’s a gain in one stage of a multi-stage system.
When you remove a constraint at one point in a system, work accelerates toward the next constraint. If you don’t address that next constraint, integration, testing, review, deployment, the queue builds. You haven’t improved throughput. You’ve changed where the backlog lives. This is a pattern that shows up everywhere in delivery systems, and understanding how to identify the bottleneck is critical before you can fix it.
Here’s what that looks like in practice. Before AI, a five-minute container build was manageable when a team was pushing code two or three times a day. With AI-assisted development enabling 20 deploys a day, that same five minutes becomes the thing grinding everything down. The delay didn’t change. The volume around it did. And any delay in the CI system that was acceptable before gets amplified because you’re context-switching into something else before it even finishes.
To make this concrete: one of us recently rebuilt a simple website using AI tooling. Two days. Close to 100 commits. The code was flowing constantly, but every commit was still hitting the same build, test, and review pipeline. The rate of input changed dramatically. The system absorbing it did not.
This is exactly what’s happening across engineering organizations that have adopted AI development tools without rethinking the downstream stages of their delivery system. More code is flowing into the pipeline faster. The constraint has moved from writing code to shipping it.
The Week a Developer’s Code Spent Waiting
Before diagnosing the fix, it’s worth understanding what the downstream actually looks like.
A developer writes a few lines of code. Done, checked in, moved on. A QA team picks it up, usually a couple of days later. They run it through a test environment, generate reports, run a full regression test. That process takes two to three times as long as writing the code did in the first place. And it isn’t even in production yet. Then the infrastructure team picks it up for the build.
Simple couple of lines of code. A week later, maybe two weeks later, it’s ready to go out.
Speed up the two hours it took to write the code. You’re really not changing the two weeks downstream.
AI didn’t create this problem. But AI is now feeding more code into it, faster than the system was designed to handle. The problem with too much work in progress amplifies this pattern: the output volume has changed. The system hasn’t.
The Scale Problem
GitHub crossed a billion commits last year for the first time in its history. This year, they’re on pace for 14 billion at current rates.
Their platform-wide uptime dipped below 90% at points over the past year , against a 99.9% SLA they promise Enterprise customers.
That’s not a knock on GitHub’s engineering. It’s an illustration of what happens when volume scales faster than the system built to support it. The same dynamic is playing out inside most engineering organizations right now, at whatever scale they operate. The code is moving faster. The infrastructure, the review processes, the governance, the test environments: they were built for a different world.
On top of that, the speed of change itself creates a problem. You can’t tell whether a change you pushed is actually working correctly if you haven’t given it enough time to run. Releasing everything you can as fast as you can isn’t useful if the feedback loop that tells you it worked is longer than your release cycle.
The Measurement Blind Spot
There’s a reason many engineering leaders are missing this signal: they’re looking at the wrong numbers.
Aggregate throughput, lines of code, pull requests, and sprint velocity tell you about activity at specific points in the system. It doesn’t tell you about the health of the system as a whole. This is exactly what watermelon metrics are: green on the outside, red on the inside.
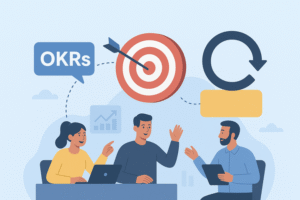
For a complete picture, you need to look at release success rate, mean time to recovery, integration frequency, and deployment frequency together — as a set of signals from a connected system. Understanding what metrics actually help your team improve means shifting from vanity metrics to system health metrics.
A high pull request volume alongside a flat deployment frequency isn’t a success story. It’s a warning signal that work is accumulating somewhere between development and production. Until that signal is interpreted through a systems lens, organizations will continue reporting strong throughput numbers while wondering why their release capacity isn’t improving.
Where Organizations Get Stuck
The most common response to this pattern is to focus on the nearest visible bottleneck, usually integration or testing, and try to speed it up. Add more automation. Hire more reviewers. Increase deployment pipeline capacity.
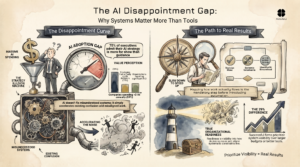
These aren’t wrong moves. But they’re often applied without a complete picture of the system. And the initial investment rarely gets to the real constraint. This is the core problem that overcoming organizational barriers addresses: when you optimize only one part of the system without understanding the whole, you move the problem, not solve it.
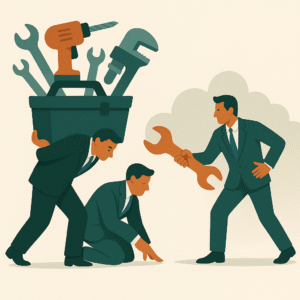
If what your organization has done is buy Copilot licenses, do the Microsoft training, and give it to the developers, don’t be surprised that you’re not getting massive productivity benefits. You’ve only impacted a tiny part of the delivery process. The fifty-step value stream that runs from requirement to production still has 47 steps that look exactly the same as before.
Effective intervention starts from visibility. What does the delivery system look like between writing code and shipping it? Where is work actually waiting? What decisions or handoffs are creating friction? What’s the relationship between the rate of incoming work and the capacity of each downstream stage?
What AI-Boosted Engineering Teams Actually Need
The teams that will convert AI’s development productivity gains into real delivery improvements aren’t necessarily the ones with the best AI tools. They’re the ones that treat their delivery system as a whole system, not as a collection of independent stages to optimize separately.
That means understanding the system before changing it. It means building visibility into the full flow of work using value stream mapping: not just the stages where AI is active, but from code to production. It means being willing to slow down the top of the pipeline, or at least pace it more deliberately, until the downstream stages can absorb the increased volume.
If your teams are generating more code but not shipping significantly more, the question to ask isn’t about development speed. It’s about what your delivery system looks like from code to production. Where is work actually stalling?
Sources
- 5 Key Takeaways from the 2026 State of Software Delivery — CircleCI
- The 2026 State of Software Delivery — CircleCI
- More Code, Less Delivery — Rob Bowley
- Measuring the Impact of Early-2025 AI on Experienced Developer Productivity — METR
- The Impact of AI on Software Engineers in 2026 — Pragmatic Engineer
- The AI Productivity Trap: Why Your Best Engineers Are Getting Slower — CIO
- The Missing GitHub Status Page