Continuous improvement is at the heart of any agile approach. But where do we start? And how can we know that our improvement initiatives are moving the needle? This blog post expands on the ideas from what throughput can tell you about your team and provides some additional thoughts to help you truly embrace the following principle from the agile manifesto:
“At regular intervals, the team reflects on how to become more effective, then tunes and adjusts its behaviour accordingly.”
Well-designed metrics provide your team with insight into where to focus and look for improvement opportunities. They also provide you with a baseline, a measuring stick to assess any improvements.
In a previous post, I focused on what we can learn from a metric as simple as throughput. Here we take it a step further.
One additional datapoint
All insights from throughput are born out of a single data point: the completion time of a work item (or two if you consider the type of work). It does not require any special tools to capture when, for example, a story gets completed. Frankly, a whiteboard and a marker will do.
With so much value from a single data point, what could we do with an additional data point?
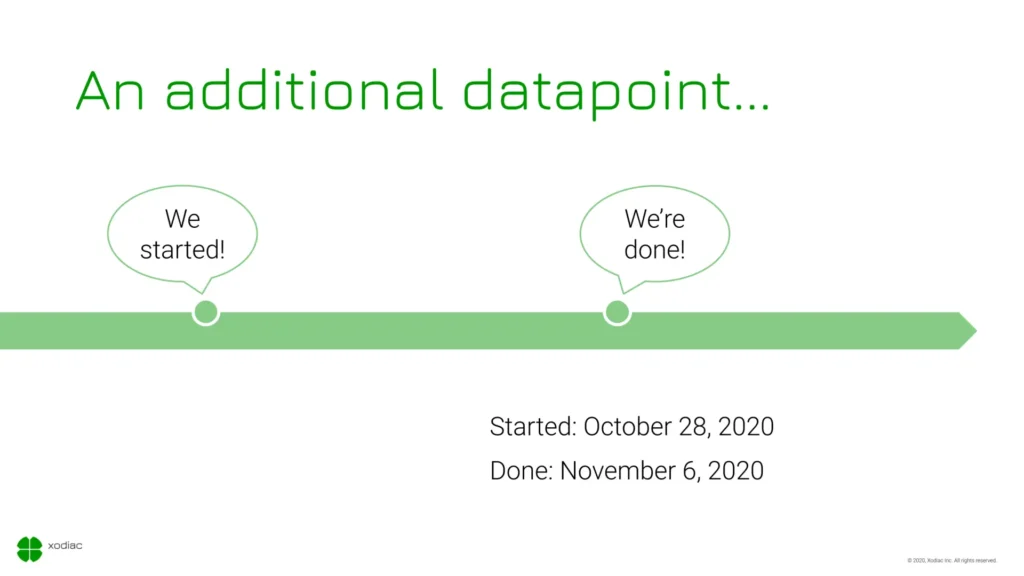
Let’s explore what we can learn by adding just one additional data point, equally easy to capture: the start time of a story.
How long does it take to deliver a feature?
While throughput says a lot about what a team can expect to complete, it does not provide insight into how long something takes. Adding this additional data point allows us to calculate the cycle time metric, which does. In simple terms, the cycle time of a work item is the amount of time that an item was in progress. In other words, it is the elapsed time between when the team started working on the item and when it was considered complete.
Variations to the question cycle time try to answer are:
- How long does it take to deliver something?
- How long before we can expect feedback?
- How much time do we need to invest before we can generate a return?
The average cycle time for all stories is a meaningful indicator of how long our stakeholders will need to wait for functionality to be available once we start working on it. But the usefulness of the metric does not stop there.
Borrowing from the field of statistics, we can calculate the standard deviation and variance of all cycle times. From these calculated values, we can learn the likely range future cycle times fall within and how well the average cycle time acts as a predictor for the cycle time of yet-to-complete pieces of work.
We prefer shorter cycle times over longer ones as they lead to faster feedback and more predictable completion dates.
How many balls are we juggling?
A common source of waste and inefficiency in software delivery is working on too many things at once. Doing so leads to context switching and lost time and energy. The work-in-progress metric at any single point in time communicates the unfinished work or, in more concrete terms, the number of things that the team has started and has yet to complete.
Since context switching has such a negative impact on productivity, keeping the work in progress low will positively impact both throughput and cycle time and complement both metrics beautifully.
The only positive about having large amounts of work in progress is that it provides the team with a clear place to start their process improvement. Any action that reduces work in progress and keeps it under control will improve productivity, predictability, and flexibility to take on urgent tasks.
How low can you go?
Maintaining too low a work-in-progress limit is not always practical. Striving to keep only a single item in progress at any given time will require all team members to swarm on all work and might encourage the team to define large work packets.
Also, when the work hits a roadblock, e.g. requiring external feedback, the team is stuck until the roadblock gets removed. On the other hand, allowing as many items in progress as the number of team members might discourage collaboration and knowledge sharing.
Work-in-progress limits are therefore best regularly assessed and tuned.
There’s more
We can learn more from our additional data point, but I will leave the discussion of failure demand for a future post. I hope that it is already clear that we don’t require expensive tools or lots of manual effort to calculate basic, yet insightful metrics to guide your team in the right direction.
When used together throughput, cycle time, and work in progress provide most teams with all the information they need to find opportunities and assess the impact of improvement initiatives.