Digital transformation is messy. It’s not just about buying new software or moving to the cloud. It’s about changing how your entire organization works, delivers value, and stays competitive. And that kind of change doesn’t happen overnight.
Here’s the problem: nearly 70% of companies say digital transformation is their most important investment, but three out of four struggle to define what success actually looks like, according to Deloitte’s Measuring Value from Digital Transformation Research. They know they need to transform, but they can’t figure out how to measure if it’s working.
That’s where OKRs (Objectives and Key Results) come in. But here’s the thing: most OKRs just measure what already happened. To really drive transformation, you need OKRs that help you steer toward your goals. That means understanding the difference between leading and lagging indicators.
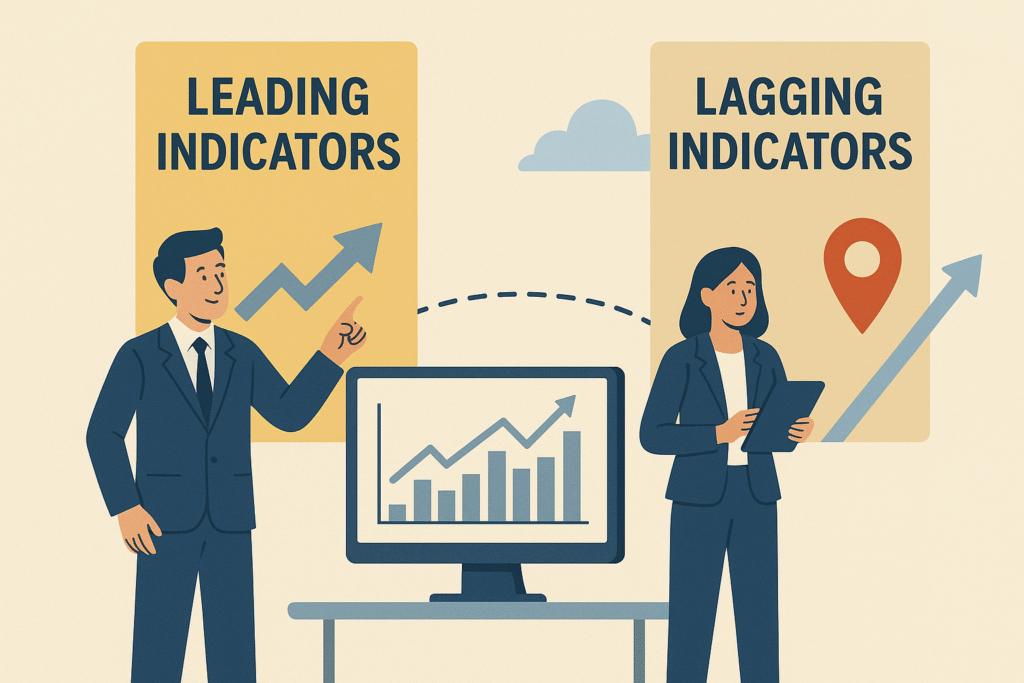
Leading vs. Lagging Indicators: A Deep Dive
Think of lagging indicators as your destination and leading indicators as your GPS.
Lagging Indicators: The Results
Lagging indicators tell you what has already happened. They’re the final score, the outcome, the bottom line. You can’t change them anymore because they’re in the past.
Examples:
- System uptime percentage
- Time-to-market for new features
- Employee satisfaction post-rollout
- Cost savings achieved
- Customer retention rates
- Revenue from digital channels
Leading Indicators: The Early Signals
Leading indicators predict what’s likely to happen. They measure the inputs and behaviors that drive your outcomes. Think of them as early warning signals that tell you if you’re on track.
Examples:
- Percentage of teams trained on new tools
- Number of legacy systems decommissioned
- API adoption rate
- Weekly usage of new platforms
- Digital engagement rates
- Process automation completion rate
Here’s the key insight from Perdoo’s research: leading indicators measure inputs to a system, lagging indicators measure outputs. Or put another way, you can control lead measures, but you can’t control lag measures.
You need both. You can’t manage what you don’t measure, but you also can’t change what already happened.
Why This Matters for Digital Transformation
Digital transformation projects take months or years. The real benefits, such as improved agility, cost savings, and better customer experience, don’t show up right away.
Sure, new AI tools, easier integrations, and low-code platforms are helping teams move faster. But that speed makes real-time measurement even more important.
If you only track lagging indicators, you’ll realize too late that you’re heading in the wrong direction. But if you also track leading indicators (adoption rates, early behaviors, foundational milestones), you can course-correct while there’s still time. This is where having invisible progress visibility in your workflow becomes crucial to avoid flying blind during transformation.
Context Matters
Here’s something important: the same metric can be leading in one situation and lagging in another. For example, quarterly upgrade revenue might be a leading indicator for company-level OKRs but a lagging indicator for product teams who can’t directly control it.
Understanding this helps teams pick the right metrics for their level of impact and control. Our blog “OKRs vs KPIs: What’s the Difference and Why It Matters” breaks down how OKRs (which measure progress toward ambitious goals) and KPIs (which track ongoing performance) work together to create a comprehensive measurement framework. When you understand these distinctions, you can better determine whether a metric should serve as a leading or lagging indicator for your specific team and objectives.
The Multi-Dimensional Challenge
Deloitte found that companies who nail transformation measurement get 20% more value from their digital initiatives. The secret? They don’t just look at financial metrics.
Successful transformation measurement needs a balanced view across:
Financial Measures: ROI, cost savings, digital revenue growth
Customer Measures: Satisfaction scores, digital engagement, retention
Process Measures: Automation rates, cycle time reduction, efficiency gains
Workforce Measures: Digital skills, adoption rates, productivity
Purpose Measures: Innovation capacity, agility improvements, competitive edge
Example OKRs in Action
Objective: Modernize internal platforms to improve agility and employee experience
Lagging Key Results:
- Achieve 80% employee satisfaction with new digital tools
- Reduce environment provisioning time from 5 days to 1 day
- Decommission 90% of legacy systems by year-end
Leading Key Results:
- Train 100% of teams on new DevOps toolchain
- Migrate 60% of apps to cloud platform by Q3
- Launch 3 feedback loops to measure user friction in first 30 days
- Hit 75% weekly active usage of new collaboration tools
Advanced Leading Indicators:
- Maintain average API response time under 200ms
- Complete security assessments for 80% of migrated apps
- Set up automated monitoring for 90% of critical processes
The lagging indicators define success. The leading indicators help you get there.
Strategic Framework for Balanced Design
The Cascade Approach
Research from What Matters shows that in larger companies, most top-level OKRs use lagging indicators because those are the end goals. As you cascade down from executive goals to day-to-day work, you should shift toward leading indicators.
This ensures:
- Executive teams focus on business outcomes
- Department leaders balance outcomes with progress metrics
- Front-line teams work on actionable, controllable indicators
The 70-20-10 Rule
For digital transformation, try this balance:
70% Leading Indicators: Behaviors and inputs you can control
20% Hybrid Indicators: Metrics showing progress toward outcomes
10% Pure Lagging Indicators: Final outcomes to validate success
How to Apply This to Your OKRs
Start with the end in mind. Define what success looks like. That’s your lagging indicator foundation.
Work backward. Map out what behaviors, adoption milestones, and changes need to happen to get that outcome.
Get everyone involved. Digital transformation touches everyone. Include engineering, HR, operations, and business teams when choosing indicators.
Review more often than quarterly. Leading indicators only help if you act on what they’re telling you. Weekly or bi-weekly reviews work better for transformation work.
Build feedback loops. Set up ways to quickly spot when your leading indicators aren’t translating to the outcomes you want.
Get your measurement infrastructure ready early. Don’t wait until mid-quarter to realize you can’t actually track your metrics.
Common Mistakes to Avoid
Only tracking outcomes: You’ll know if transformation worked, but not why.
Vague leading indicators: “Improve adoption” isn’t helpful. “80% of users log in weekly” is.
Ignoring behavior change: New technology without behavior change isn’t transformation. It’s expensive shelfware.
Picking uncontrollable metrics: Teams get frustrated when success depends on things they can’t influence.
Assuming correlation: Don’t assume that improving leading indicators automatically improves lagging ones. Test that assumption.
Unrealistic timelines: Don’t expect lagging indicators to respond immediately to leading indicator changes.
Advanced Considerations
Industry Differences
Different industries need different indicator mixes. Manufacturing companies might focus on operational efficiency, while service companies emphasize customer experience. Match your indicators to what drives value in your industry.
Digital Maturity Stages
Where you are in your digital journey affects what you should measure:
Digital beginners: Focus on adoption and basic capabilities
Digital adopters: Balance adoption with efficiency improvements
Digital leaders: Emphasize innovation and competitive advantage
Cultural Change Indicators
Don’t forget to measure cultural shifts:
- Cross-functional collaboration frequency
- Employee-initiated improvement ideas
- Decision-making speed
- Willingness to experiment and learn from failures
Wrapping Up
Digital transformation is about momentum as much as milestones. Your OKRs should help you measure results AND create the behaviors that drive them.
When you balance leading and lagging indicators, you make transformation measurable, manageable, and successful. Companies that get this right don’t just complete digital transformation projects; they turn them into lasting competitive advantages.
Remember: your OKRs should evolve as you learn. Start with your best guess about which leading indicators will drive your outcomes, then adjust based on what you discover. Perfect prediction isn’t the goal. Smart navigation through complex change is.
