
In previous posts, we discussed what you can learn about your team from tracking a minimum of data. We introduced throughput as the most meaningful metric you can get from only the completion time of a work item.
In a subsequent post, we explained how you can calculate cycle time and work in progress by tracking the start time of a work item. In this post, we focus solely on how to calculate failure demand and what it tells you about the true delivery capacity of your team.
My introduction to the concept of failure demand was by Mary Poppendieck, who explained it as:
“the demand on the team due to system failure or inefficiencies.”
Ward Cunningham calls this technical debt. I like Mary’s definition because it puts it in stark contrast to feature demand, which is the demand from your customers or users. Both feature demand and failure demand are competing for the same resources.
While failure demand is difficult to calculate, we have found meaningful approximations that are easy to measure yet provide the team with valuable information when considering what to improve next.
How to measure?
We are interested in how much of our productive time is spent on fixing quality issues and therefore not on providing more value for our customers. The simplest form of failure demand is to calculate every week:
“number of bugs fixed / number of stories completed”
This only gives us a ratio and does not consider the relative time spent on implementing stories or fixing bugs. Therefore the metric will likely not represent a percentage of the team’s productive time spent on dealing with quality issues. Even with this caveat, observing the trend of this metric will provide plenty of insight into the impact of:
- a release on productive time, e.g. when failure demand spikes after a release to production
- delivery pressure in the face of a deadline, e.g. when open bug counts go up but failure demand stays low
- not paying enough attention to code cleanup, e.g. when failure demand gradually increases over time
Can we calculate the cost of failure demand?
I’m not aware of any metric that can calculate the cost of failure demand precisely. After all, your software quality issues will impact how long it will take for a developer to add new functionality.
It will impact how many places documentation needs to be updated and how much time needs to be spent on regression testing.
However, when you enrich the basic formula above with the information you can get from cycle time, one can calculate a meaningful approximation of how much of a team’s productive time is spent on fixing bugs.
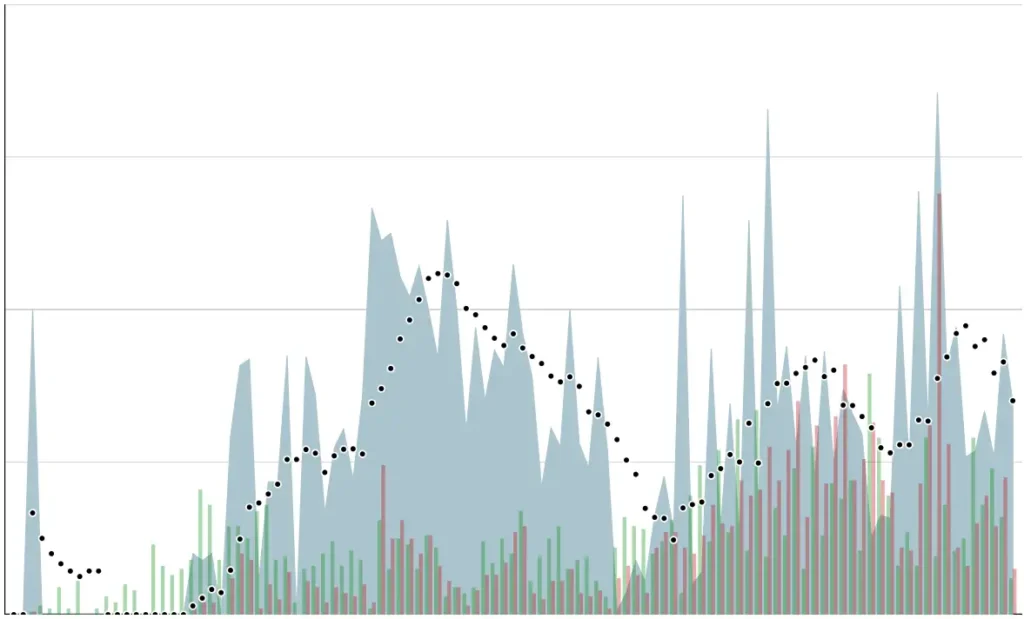
The graph above shows how one team we worked with – based on the most elaborate measurement of failure demand – spent between a quarter and half of their productive time on fixing production bugs. By all accounts, this team was considered highly productive, as it closed many tickets…
When we presented this view to the team, they only then realized how much technical debt was slowing them down.
I can game this!
Of course, you can. Any metric can be gamed. By classifying most bugs as an enhancement, by delegating bugs to another team, or when using the more sophisticated version even by not including the root cause analysis in the measurement, the metric is entirely skewed and becomes almost meaningless.
However, if the metric is only made visible within your team and helps you identify what to improve next, what would the value be of gaming it?
Measure to improve, not to impress
I encourage you to measure failure demand for your team. Try not to make a target out of it and don’t advertise it on management dashboards. Use it as an indication of what your team is spending its time on, and of the quality of the system.
Use it to support your gut feeling that it’s time to refactor a component or inspire your team to focus on more than merely getting stories out of the door.