Blog

Read Our Perspectives: Articles On Strategy And Innovation

Latest Post

Go directly to the latest
Blog posted

Entire Collection

Explore all the
Blogs posted

Latest Post

How to Measure AI ROI: The Outcomes Chain Framework

GitHub Copilot deployed. Developer satisfaction up. PR volume at an all-time high. Release cycle time hadn't moved. Activity metrics show motion — not progress. Here's the framework that connects your AI tools to the business outcomes that actually matter.

All Blog Posts

Infographic titled "Motion vs. Progress: The AI Outcomes Chain" showing a cross-sectioned watermelon representing watermelon metrics, with three perspectives labeled — Local Activity, Systemic Flow, and Business Impact — alongside a three-step sidebar for building the outcomes chain.

How to Measure AI ROI: The Outcomes Chain Framework

GitHub Copilot deployed. Developer satisfaction up. PR volume at an all-time high. Release cycle time hadn't moved. Activity metrics show motion — not progress. Here's the framework that connects your AI tools to the business outcomes that actually matter.
Infographic titled "The AI Spend Mandate: Is Your Investment Actually Just an Expense? Shifting from FOMO-driven spending to managed governance." Two sections. Left: "The Governance Gap" — an illustration of a ship labeled "The Organization" sailing through "FOMO Fog," with a figure declaring "Deploy AI like everyone else! Competitors are doing it!" Key statistics shown: 57% of leaders deployed AI primarily because competitors did; developers can be 19% slower with AI when tools are mismatched to tasks; 85% of organizations miss their AI cost forecasts because spend is distributed across fragmented invoices. A value realization chart shows 74% of organizations failing to scale value versus 4% consistently generating value. Right: "The Three Pillars of Governance" — illustrated columns labeled Spend, Match Model to Task, and Define Business Outcomes. Guidance includes: inventory every subscription and API contract by team and use case; use lightweight models for routine tasks to reduce spend 20–40% without losing quality; connect spend to a CFO-readable metric like reduced delivery time. Closing line: "By implementing this governance layer, leaders can turn opaque AI costs into a managed investment portfolio." Xodiac logo bottom right.

AI Spend Governance: Why Most Technology Leaders Can’t Answer the Three Questions That Matter

sk a technology leader what their organization spent on AI last month. Not which tools the team uses. The actual number, broken down by team, tool, and use case. Most can't answer it. That's not a technology problem. It's a governance problem.
AI burnout paradox infographic: early adopters carry the highest cognitive load — brain fry anatomy, system redesign, and strategic prioritization with OKRs

AI Burnout: The People Who Said Yes First Are Paying the Price

The workers burning out fastest in 2026 aren't the ones who resisted AI — they're the ones who embraced it first. New research from HBR and BCG reveals why early adopters are carrying the heaviest cognitive load, and why AI burnout is a system design problem, not a people problem.
Infographic showing the AI bottleneck shift: PR volume up 98%, review time up 91%, and $23,780 lost per developer per year due to AI code review delays

Faster Code. Slower Shipping. The AI Code Review Problem.

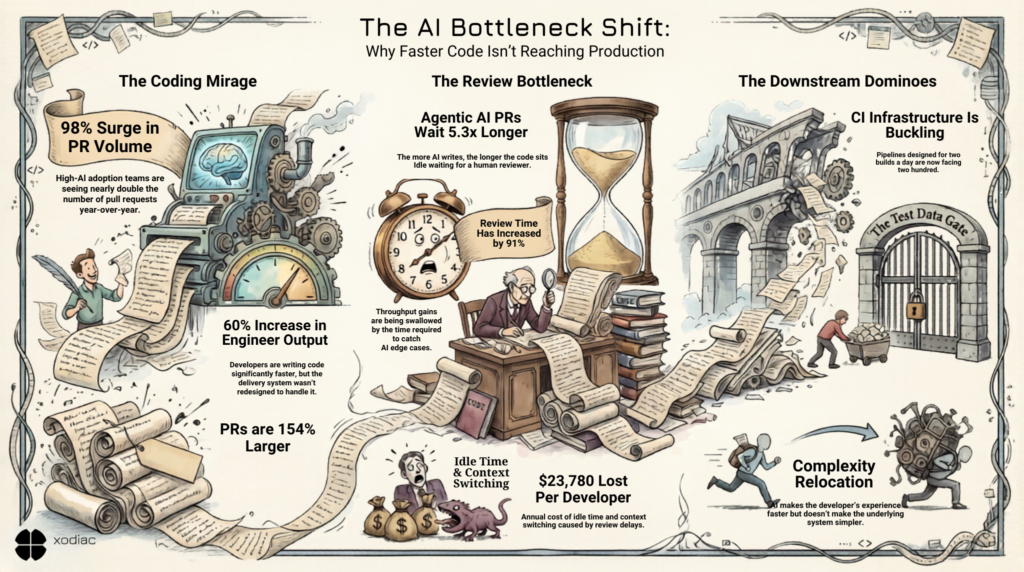
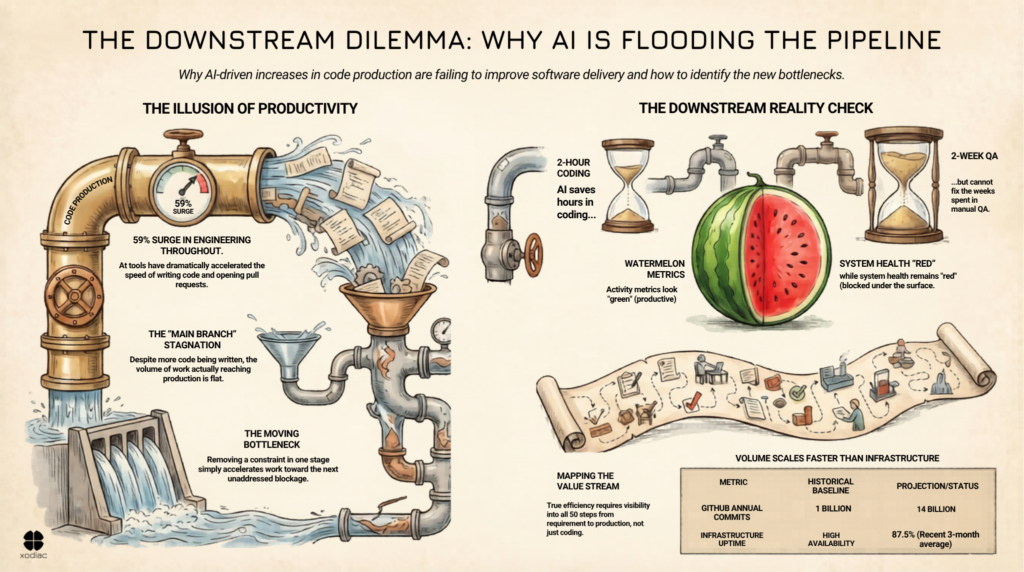
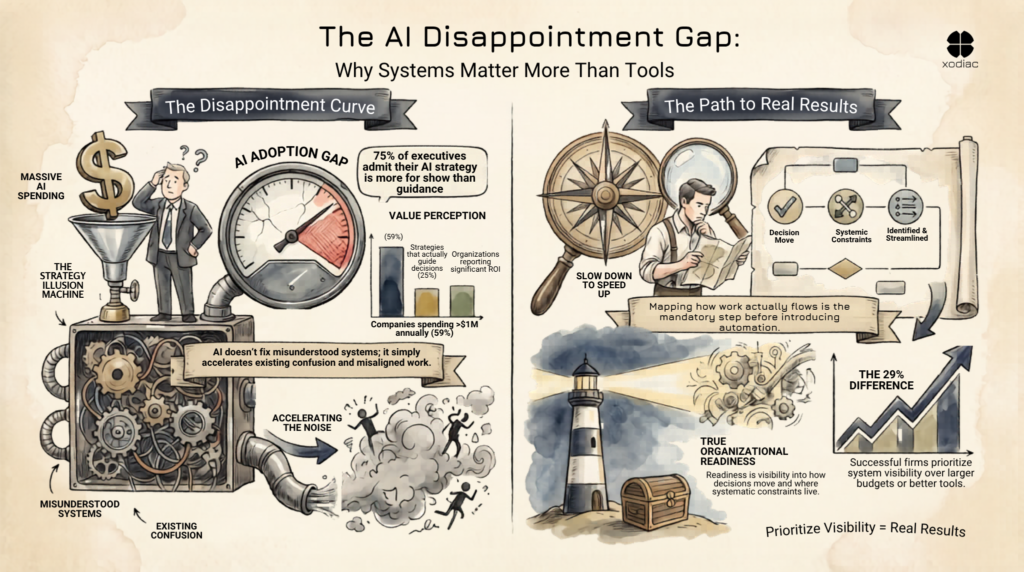
AI doubled your PR volume. Review time went up 91%. The AI code review problem isn't a tooling failure — it's a delivery system that wasn't redesigned around the tools. Here's where the constraint moved, what it's costing, and the question every engineering leader should be asking before the next AI tool enters the pipeline.
AI tools have increased engineering throughput by 59% — but release frequency is flat. Discover why the bottleneck didn't disappear, it just moved downstream, and what your team should measure instead.

The Bottleneck Didn’t Disappear. It Moved.

Engineering throughput is up 59% with AI tools. So why aren't teams shipping more? The bottleneck didn't disappear—it moved downstream.
Infographic showing the AI Disappointment Gap — why massive AI spending fails without system visibility, and how the 29% achieving real ROI mapped their delivery systems first

Why AI Adoption Is Disappointing, And What the Data Tells Us About Who Gets It Right

48% of enterprise leaders report AI adoption as disappointing. Discover why most organizations fail at AI ROI and what the data reveals about who gets it right.